Overall the industry polling, including those polls conducted by Electoral Calculus and Find Out Now, overestimated the Labour lead at the 2024 general election.
| Party | MRP VI | Classic VI | Poll of polls | Actual GE |
|---|---|---|---|---|
| CON | 15% | 16% | 22% | 24% |
| LAB | 40% | 40% | 39% | 35% |
| LIB | 14% | 13% | 11% | 13% |
| Reform | 17% | 18% | 16% | 15% |
| Green | 7% | 8% | 6% | 7% |
| Turnout | 67% | 68% | n/a | 60% |
| LAB lead | 25% | 24% | 17% | 10% |
Table 1: Estimated vote shares from final EC/FON poll, and final poll-of-polls industry average.
Using both MRP and Classic methods, the Conservative vote share was under-estimated, the Labour vote share was over-estimated and the Turnout was over-estimated.
This led to mis-predictions in the seat totals.
If the national VI figures had been more accurate, then the seat totals would have been much more accurate too. See Track Record 2024 for details.
There was little difference between our classic and MRP VI figures, which is in contrast to some other pollsters, such as YouGov.
This document investigates potential causes of the polling error as we have been able to estimate using our own analysis and data from Find Out Now.
The first section below looks at the results of a recall poll conducted in July; next we look at a set of different experiments which did not give a positive result; thirdly we discover an experiment which is more positive; and lastly we conclude and summarise.
Find Out Now performed a recall poll for us after the election to check how people actually voted.
The poll sampled 18,616 people from 8-15 July 2024 (Data Tables).
| Party | MRP VI | Classic VI | Poll of polls | Actual GE |
|---|---|---|---|---|
| CON | 17% | 18% | 22% | 24% |
| LAB | 36% | 37% | 39% | 35% |
| LIB | 15% | 14% | 11% | 13% |
| Reform | 18% | 17% | 16% | 15% |
| Green | 8% | 8% | 6% | 7% |
| Turnout | 77% | 77% | n/a | 60% |
| LAB lead | 19% | 19% | 17% | 10% |
Table 2: Estimated vote shares from recall poll, and final poll-of-polls industry average.
These figures are only slightly better. The classic VI Labour lead of 24% in June has been reduced to 19%, which is still higher than the true figure of 10%. Though the turnout estimate has deteriorated. Perhaps some people are reluctant to say that they did not vote.
A number of experiments were conducted to try and identify the cause of the polling error. This were mostly negative or inconclusive, but are presented here for reference.
Our quotas for GE2019 and EU2016 combined into the did not vote ("ZNV") category, both those who were eligible to vote and chose not to, and those who were too young to vote at the time.
To address this, the ZNV category was split into two groups: actual ZNV (chose not to vote) and YNV (too young to vote). Quotas were created and classic VI re-run. The Labour lead was steady at 19%.
Another idea was to look at those panel members who refused to take part in the VI polls. We name this group the "skippers", because they chose to skip the VI survey.
Find Out Now supplied the demographics of the skippers, for comparison. Of course, we don't have their voting intention because they skipped the poll.
The June poll is better for comparison, because there is a larger set of skippers
| Topic | Label | Census | Poll | Skipper | Skip-Poll Diff | Narrative |
|---|---|---|---|---|---|---|
| Age | 18-24 | 10% | 1% | 10% | 8% | Youngsters skip |
| Class | AB | 23% | 45% | 39% | -5% | Posh non-skip |
| Tenure | Owned | 64% | 69% | 58% | -11% | Owner non-skip |
| Tenure | Private Rented | 19% | 20% | 30% | 10% | Renter skip |
| Marital | Married | 45% | 50% | 43% | -8% | Married non-skip |
| EU2016 | Remain | 35% | 47% | 37% | -10% | Remain non-skip |
| EU2016 | ZNV | 27% | 13% | 26% | 13% | EU ZNV skip |
| GE2019 | LAB | 22% | 30% | 25% | -6% | LAB non-skip |
| GE2019 | ZNV | 33% | 16% | 28% | 13% | GE ZNV skip |
Table 3: Relevant demographics of skipping population compared with poll and census.
The skipping population is closer to the census quota on most topics (except Tenure). This is suggestive that the respondents are a bit skewed. Importantly, there are not a large number of 2019 Conservative voters among the skippers (see "Shy Tories" in section 3 below).

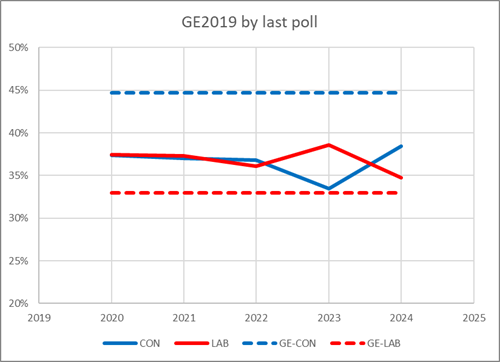
Figure 4: Graph of GE2019 Con/Lab vote share, by year of last poll answered.
We also looked at those members of the panel who have quit, or at least have stopped answering questions at all. Breaking the "quitters" down by both the last year that they answered a question and also their GE2019 vote, we can check if the quitters are skewed to the Conservatives. The data does not show that – panel quitters are fairly even in being 37% Conservative over the period 2020-2022. Since that is less than the Conservative population (45% of those who voted), it does not suggest that Conservatives were quitting the panel disproportionately.
Another idea is to look at when panel members joined the panel. Older members might be different from newer members because
We divided the panel into two parts: those who joined before 1 Sep 2019 (old) and those who joined after 1 Sep 2019 (new).
| Party | All Panel | Old Panel | New Panel |
|---|---|---|---|
| CON | 18% | 18% | 18% |
| LAB | 37% | 37% | 37% |
| LIB | 14% | 13% | 14% |
| Reform | 17% | 17% | 17% |
| Green | 8% | 9% | 8% |
| NAT | 3% | 4% | 3% |
| OTH | 2% | 3% | 2% |
Table 5: Classic VI for older and newer panellists.
The table shows Classic VI for older and newer panellists. There is no significant difference.
Our quota weighting is mostly based on marginals only. We could improve that by using bivariate quotas, such as the combination of GE2019 and EU2016 vote.
We have three different ways of inferring the bivariate quotas:
The British Election Study (BES) data is useful as a cross-check, because it is from an earlier period (before Partygate and the fall of Johnson, Truss, etc) and it comes from a different panel (YouGov).
This lets us see if there are differences in the bivariate quotas between our panel respondents, the skippers, and an earlier benchmark.
We can look at our (weighted) sample to see the bivariate distribution of GE2019 and EU2016. We compared this the MRP-derived figures from the poll. This showed very small differences.
We also did the same thing with an MRP poll from February 2021, to get MRP-derived bivariate quotas. These were also very similar to the MRP-derived bivariate figures from the recall poll. The table shows the bivariate quotas which were looked at, and whether noticeable differences were seen.
| Topic Combination | Comparison Respondents vs Skippers | Comparison Respondents vs BES |
|---|---|---|
| GE2019 x EU2016 | Good agreement | Good agreement |
| GE2019 x Education | Good agreement | BES has more University educated (marginal quota difference) |
| GE2019 x Class | Good agreement | Good agreement |
| GE2019 x Age | Good agreement | Good agreement |
| Class x EU2016 | Good agreement | Good agreement |
Table 6: Analysis of various bivariate quotas
Overall, there is no significant differences shown up by this analysis.
We also regressed GE2019 against the other demographics, and use that to infer GE2019 x Age quotas by seat/ward chunk. This then gives an MRP prediction using GE2019 x Age.
The MRP VI had a Labour lead of 18%, which is not a material improvement.
Usually, our MRP process lets the algorithm choose the topic string. It selects topics which explain VI variance most effectively, without over-fitting the model.
We experimented with different specific topic strings, to see if there were notable differences. We were looking for topics, which if omitted, could move the MRP VI figures.
Over 30 variants were tried, but the Labour lead held steady at 19% or higher.
The only exceptions were:
No obvious conclusion can be drawn.
We also looked at these two extra variates: political attention which measures how much attention respondents give to political matters (on a score of 0-10); and how much respondents use the internet each day.
Firstly, we looked at Political Attention, using 3 buckets (Low 0-2, Medium 3-6, High 7-10). Broken down by GE2019, the Medium bucket was the most Conservative.
Looking at VI2024, the Labour lead was 22% for Low, 13% for Medium and 22% for High.
We made the assumption that our sample is undersampling GE2019:Con x Low, so we made a quota that assumed a higher fraction of those. Then we re-ran classic VI on VI2024 but the Labour lead was still 19% .
Then we tried making quotas for these two variates
The classic VI2024 Labour lead was 17%, which is a slight improvement, but not very large.
We also looked at which demographic groups demonstrated the most loyalty to the Conservatives.
For each demographic group (eg Gender:Female, or Class:AB) we looked at the unweighted fraction of 2019 Conservative voters who stuck with the party in 2024.The true overall loyalty rate is about 48%, but our sample had an average of 42%.
We only saw a loyalty rate of at least 48% in only four out of 55 demographic groups
| Topic | Value | Loyalty |
|---|---|---|
| Age | 65+ | 51% |
| OccStatus | Retired | 51% |
| Marital | Widowed | 49% |
| Area | London | 49% |
Table 7: Loyalty rates of various demographic sub-groups
This doesn't suggest that it is purely a question of poor weighting, since almost all the demographic groups show a loyalty rate which is lower than the actual rate. This raises the question of whether respondents misreported their 2024 vote, or whether loyal Conservatives are less likely to take part in polling.
We asked people in the poll to estimate how likely they were to turnout on a scale of 0-10. We assumed that only those answering 8, 9 or 10 would actually vote, and that the others would not vote. But perhaps this was optimistic for some voters who over-estimated their chance of voting.
To explain the poll error, we could assume that a certain fraction of "likely" voters would actually not vote. The required scale factors vary by party and are shown in the table below for both the final and recall polls:
| Party | Scale factor (June poll) | Scale factor (July recall poll) |
|---|---|---|
| CON | 0% | 0% |
| LAB | 41% | 20% |
| LIB | 32% | 31% |
| Reform | 44% | 37% |
| Green | 41% | 36% |
| Implied turnout | 46% | 58% |
The scale factors for the June poll are quite large, suggesting about two non-Conservative voters in five over-estimated their turnout. The implied turnout figure of 46% is also significantly less than the true figure of 60%.
The Labour scale factor (the most important) also varies greatly between the two polls, which is unsatisfactory. And these scale factors are hard to determine ex-ante.
Taken together, that suggests rather that the problem is missing Conservative voters (particularly in June), rather than over-optimistic turnout likelihoods from non-Conservatives.
The recall poll also lets us see if there are any differences between how an individual said they would before the election, and how they said they had voted after the election.
Although there were some people who gave a different party, there was no particular trend to those movements, which broadly cancelled out. There were more people who said in June that they were unlikely to vote, but claimed in July to have voted.
This helped reduce the Labour lead, but increased the turnout from 68% to 77%, compared with the actual turnout of 60%. This suggests that the recall respondents may be exaggerating their turnout, but it does not give evidence of late swing from Labour to Conservative.
Perhaps there was reluctance to take part in surveys, in a way that skewed the results. The hypothesis is that people who voted Conservative in 2019 and who intended to vote Conservative in 2024 were more likely than average to skip the survey.
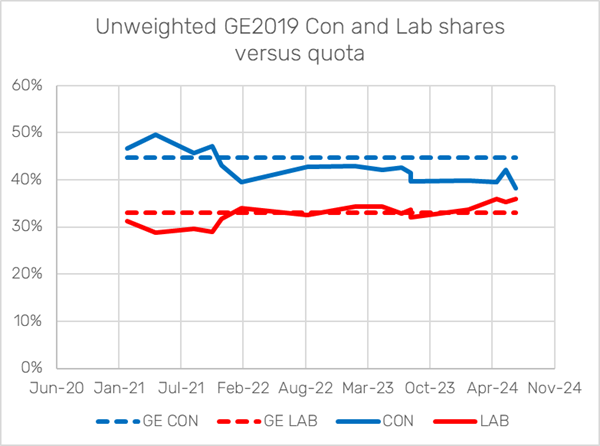
We can see evidence for this by looking at the record of all our MRP polls with Find Out Now since 2019. We look at the unweighted fractions of GE2019 stated vote.

Figure 8: Graph of unweighted GE2019 Con and Lab shares, versus quota, for all EC/FON MRP polls since 2019.
The graph shows a decline in the response rate from those who voted Conservative in 2019. The decline was particularly marked around early 2022 when Partygate was an issue.
If this decline were uniform across 2019 Conservatives it would not matter, since the classic polling weights and MRP analysis would both correct for it. But if the decline is concentrated among those who intend to vote Conservative at the next general election, then this change will skew the poll results.
But for this effect to make a real difference we would have to assume that around 40% of loyal Conservatives refused to take party in surveys.
But if this hypothesis were true, we should see these loyal Conservatives either in the panel 'skippers' or 'quitters' in section 2.2 above. We don't see large numbers of Conservative skippers or quitters (and there would have to be very large numbers to match those missing from the surveys). This explanation is also not very helpful for the future, because it is hard to objectively estimate the fraction of "missing" Conservative loyalists.
We get more interesting results when we look at those people who refused to answer the voting intention question, or said that they didn't know how they would vote.
We can reduce the polling error with the following hypothesis about voting intention:
We combine that with the additional hypothesis about turnout likelihood inspired by section 2.7 above:
With that combination of hypotheses, we get the following voting intention shares from the June and July polls:
| Party | June Poll | July Poll | Actual Result |
|---|---|---|---|
| CON | 23% | 24% | 24% |
| LAB | 36% | 34% | 35% |
| LIB | 12% | 13% | 13% |
| Reform | 15% | 15% | 15% |
| Green | 7% | 7% | 7% |
| Turnout | 59% | 65% | 60% |
Table 9: Adjusted classic vote shares for final campaign and recall polls.
These adjusted VI estimates are much closer to the actual result. The turnout estimates are also much improved, if not exact.
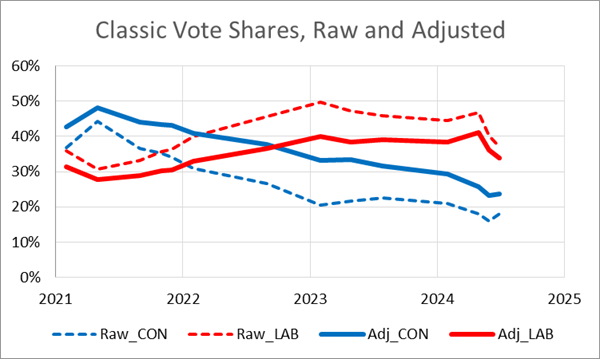
We can also apply this method to all the MRP polls conducted with Find Out Now in 2021-2024 to see the raw and adjusted vote shares for the two major parties.

Figure 10: Classic Vote Shares, Raw and Adjusted
The true final figures were Labour 35%, and Conservative 24%. The adjusted final campaign poll has 36% and 23%, which are within 1% of the true figures. The adjusted figures look credible over the period, and finish up much more accurately than the unadjusted raw figures.
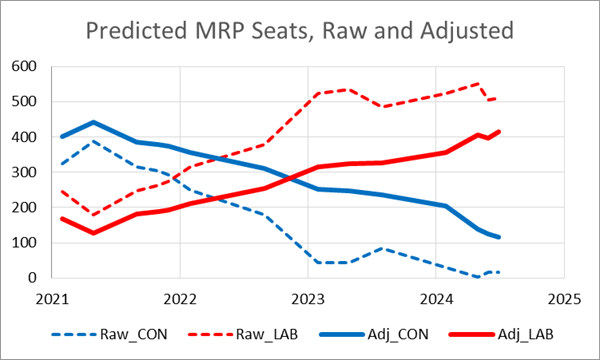
In terms of predicted seats, we get these results.

Figure 11: Predicted MRP Seats, Raw and Adjusted
The true figures were Labour 412 and Conservative 121. The adjusted final campaign poll has 397 and 124. Again these figures are credible over the period, and finish up much more accurately than the unadjusted MRP figures.
Whether these attractive results are accidental or significant is hard to determine. But it is a plausible explanation that only relies on two credible assumptions, even if they are hard to verify.
There were too few Conservative supporters in our polls. If they weren't showing up as Conservative supporters in our survey, then they must be somewhere else. That could be one or more of the following:
The first of these is hard to rule out, but feels unlikely. Both FON and other industry panels had good results in 2019, so there must have been sufficient Conservative supporters at that time.
The second explanation was investigated in section 2.2, but there was no evidence of Conservative bias in the population that quit the panel.
The third explanation was also considered in section 2.2, but there were not enough Conservative skippers to explain the poll error.
The fourth hypothesis about the don't knows and refuseds is suggestive, especially when combined with a mild assumption about over-promising to turnout from non-Conservatives. Section 3 above shows that two moderate assumptions are enough to explain almost all of the polling error.
The fifth explanation looks unlikely. The data used in section 2.7 also shows that there are few Conservatives who said "will not vote". That section also shows that it's unlikely that the poll error can be explained by non-Conservative voters over-estimating their likelihood to vote.
The final explanation is not supported by the recall poll evidence, although it is theoretically possible that respondents continue to mislead pollsters about how they voted.
Of course, there is always the "Orient Express" solution where multiple possible causes are examined and all those which reduce the error are deemed to be part of the solution. This can be credible for two or three causes, but feels more a stretch if it is extended to many separate reasons.
At the moment, it is hard to be definitive, but the most credible explanation is a combination of two hypotheses:
Under those assumptions, the bulk of the polling error disappears.