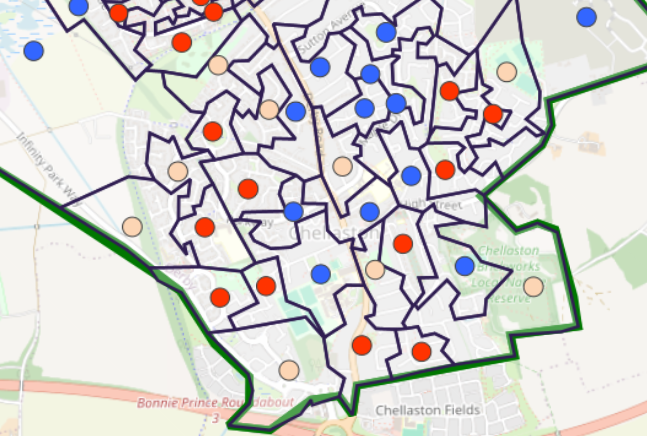
Map: Street-level view of Chellaston in the constituency of Derby South, showing the estimated results of the 2024 General Election by Census Output Area.
Custom Analytic Solutions
We can also supply custom solutions to the processing of polls, including regression analysis. This is particularly useful for organisations which have a steady stream of incoming polling data which needs to be processed as quickly and cheaply as possible.
With our unique, lightning-fast and robust analytics library, called TigerLib, we can provide on-site or on-line analytic solutions customised for your poll processing needs.
Please get in touch to find out how we can help with your project or campaign.
Campaign Integration
The insights from regression polling can be integrated into your campaigning in three main ways.
Firstly, the visual maps can help local campaigners on the ground to target messaging in the most effective way. By having insight into the likely political attitudes of each small area, they can target resources and messaging more efficiently.
Secondly, the geographic information can also be cross-referenced with your own database of contacts and their postal addresses. You can send direct mail on a topic to those contacts who are most likely to find it interesting.
And finally, the regression produces demographic profiles of your key target audiences or market segments. These profiles can then be integrated into social media campaigns to target your messages to the right audience.
Find out more:
If you have any questions or would like to discuss a possible project, please get in touch, or reach us on the contact details below:
Email:
Telephone: 020 3627 8141.